Statistics Overview
BeeCount provides rich statistics to help you understand your financial situation.
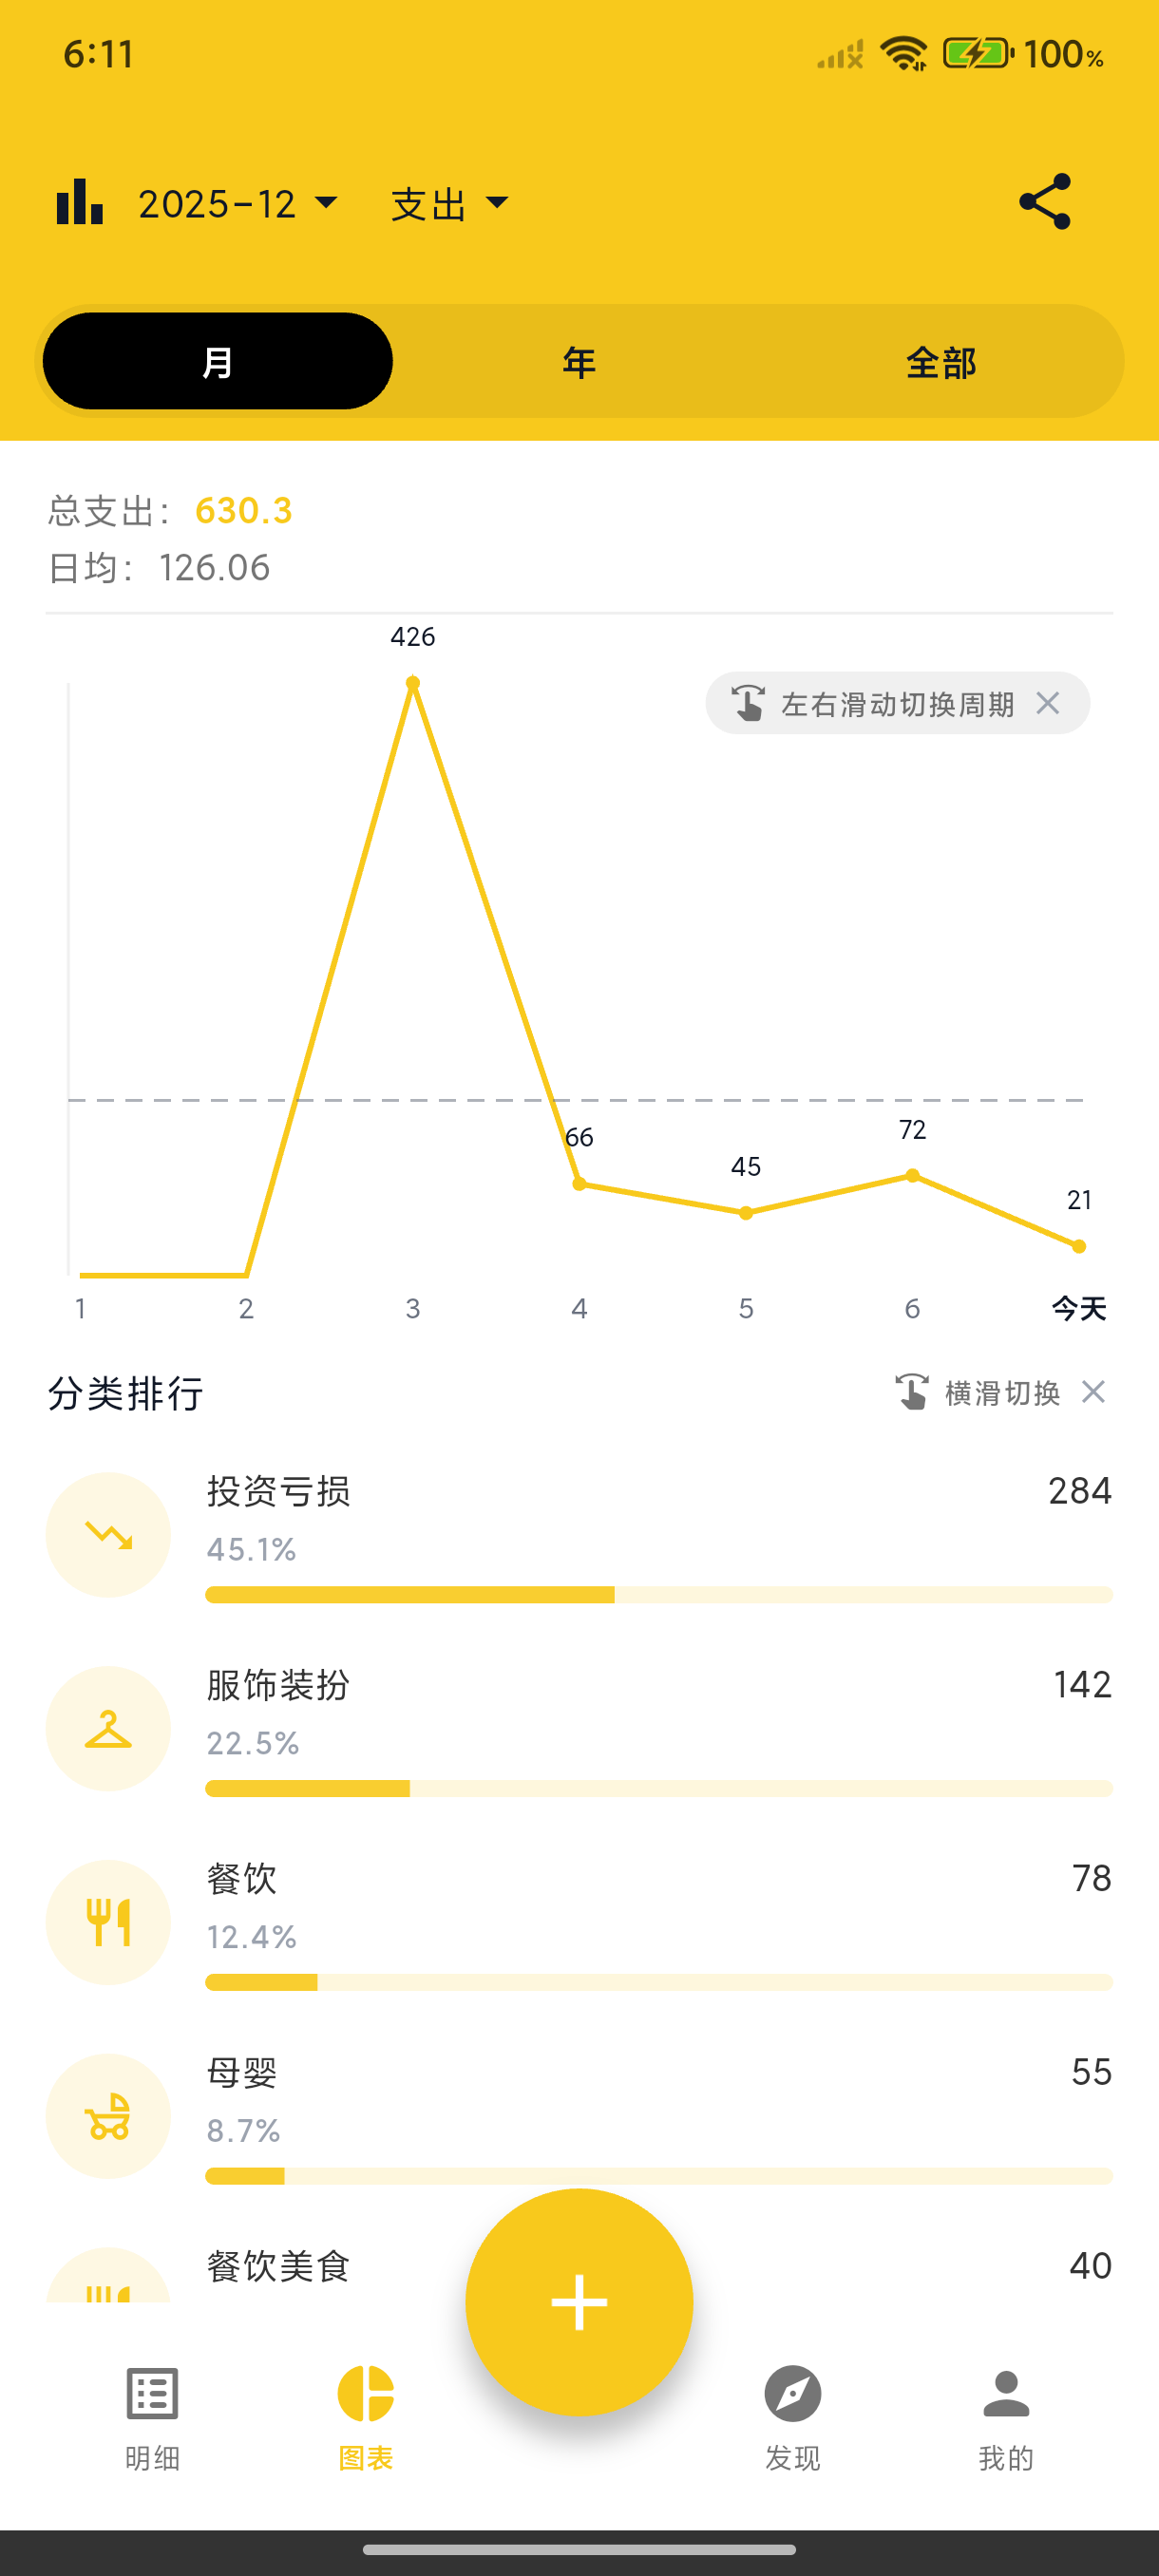
Home Page Statistics
The home page header shows current month:
- Income - Total income this month
- Expenses - Total expenses this month
- Balance - Income minus expenses
Tap the eye icon to hide/show amounts.
✨ Since v3.4.0: "this month" can start on any day you choose — set the ledger's Month Start Day (1-28) to your payday, and home, statistics and budgets all follow your accounting cycle.
Statistics Page
Tap "Stats" in the bottom navigation for detailed analysis:
Income & Expense Trends
Line charts show daily income and expense changes, giving insight into spending patterns.
Category Breakdown
Pie charts show the proportion of expenses by category, identifying main spending areas.
Category Ranking
List view shows categories ranked by amount. Tap to view details.
Time Range
- Swipe left/right to switch months
- View by week, month, or year
- Select custom date ranges