Statistics & Analysis
BeeCount provides rich statistical charts to help you understand your financial situation.
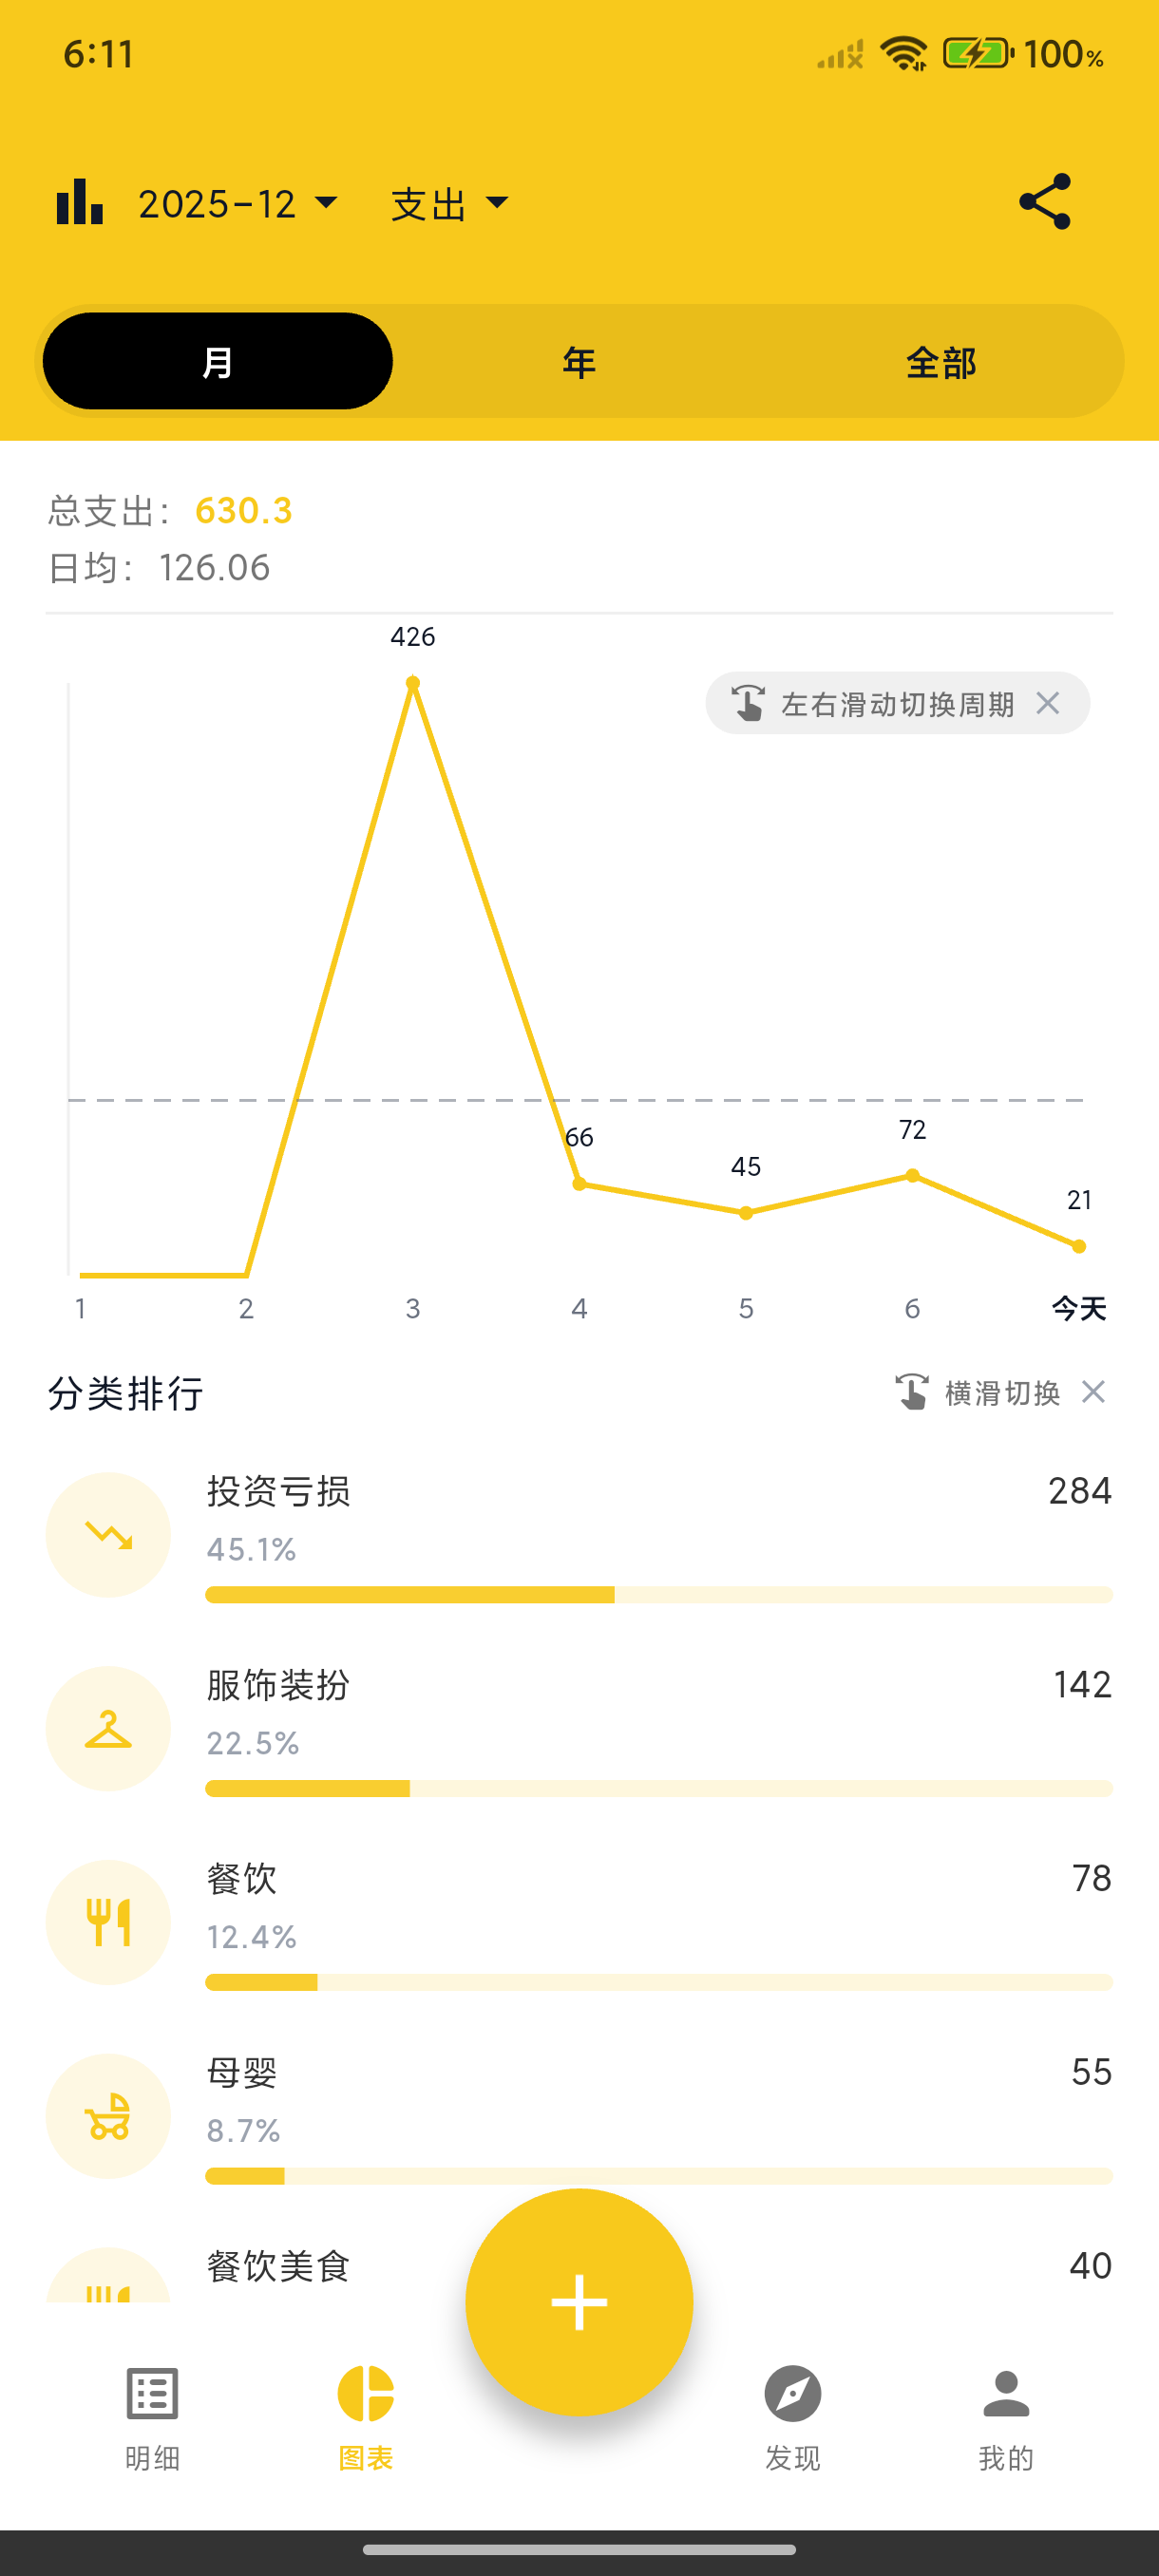
Income & Expense Trends
Line charts show daily/weekly/monthly income and expense trends, giving you insight into your spending patterns.
Category Breakdown
Pie charts show the proportion of expenses by category, helping you identify your main spending areas.
Category Ranking
A list view shows categories ranked by amount. Tap to view all transactions in that category.
Time Filter
View statistics by week, month, or year. Swipe left/right to switch between time periods.
Web Statistics
After signing in to BeeCount Cloud on the web, the desktop browser unlocks richer visualizations:
- Home hero — current-month summary + income/expense curve + asset composition donut + top categories / tags / accounts
- Overview page — multi-month comparison, dual-line income/expense, MoM diff
- Calendar view — month-grid by day with net values; click a cell to see transactions
- Annual report — 12-screen immersive recap, shareable poster (great for year-end review)
- Analytics page — cross-month trends + deep category analysis
All data shares the same cloud ledger as mobile, so the analytics figures match exactly.